
September 9, 2026
Is Someone Wrong About Micron?
Micron (MU) reported the biggest quarter in its history. Revenue up 346% year over year. Gross margins of 84.9%. Guidance so far above Wall Street's number that analysts had to go back and check their models.
The stock is down 19% since then.
Think about that for a second…
A company printing money at a pace nobody saw coming, and a stock that’s spent two months getting sold by investors who can't decide whether to believe it.
The 52-week range is $114 to $1,255. Pick a number, any number, and you can find a narrative to support it.
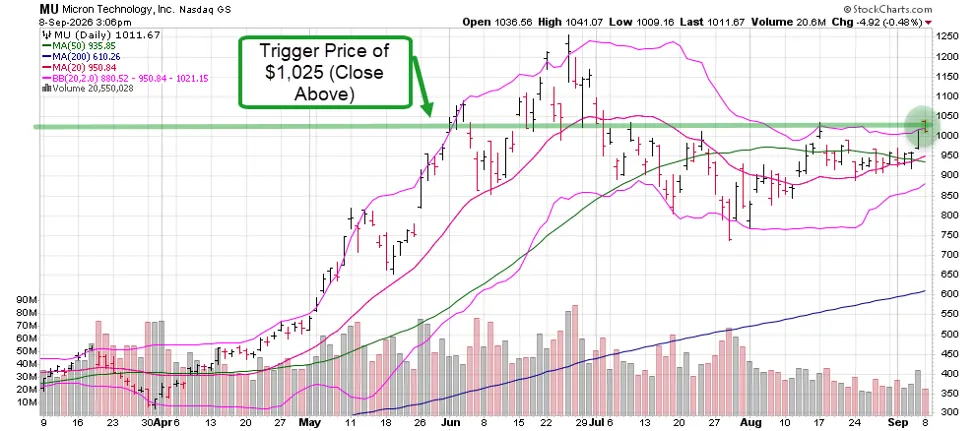
Right now MU is sitting around $1,016, holding $1,000 by its fingernails, and something interesting is happening on the chart.
The Bollinger Bands (a measure of how compressed or expanded price movement is) are tighter right now than at any point since April. That kind of squeeze doesn't sit still.
It resolves into a big move, and the short-term momentum is pointing up. The 20-day moving average just crossed above the 50-day, which tells you buyers have been quietly showing up.